
Gamification metrics reveal whether your loyalty program actually drives business results or just creates flashy distractions. Most companies track surface-level engagement but miss the deeper behavioral shifts that matter.
We at Reward the World see businesses struggle with measuring true program impact beyond basic participation rates. The right measurement framework separates successful programs from expensive experiments.
Which Metrics Actually Predict Program Success
The gap between program activity and business impact becomes clear when you examine the right metrics. Participation rates tell you who joins, but engagement depth reveals who stays committed. Track daily active users versus weekly participants – programs with 40% daily engagement typically generate 3x more revenue than those that rely on monthly interactions.
Measure progression velocity by monitoring how quickly members advance through game levels or challenges. Starbucks reports that customers who complete bonus challenges spend 2.5x more per visit than passive members. Focus on completion rates for specific tasks rather than overall program enrollment numbers.
Revenue Attribution Through Game Elements
Customer lifetime value increases by 22% when game mechanics drive purchasing decisions. Calculate incremental revenue by comparing pre-program and post-program spending patterns within the same customer cohort. Limango achieved a threefold increase in purchase frequency through targeted loyalty tactics.
Track revenue per game interaction to identify which mechanics generate actual sales versus mere engagement. Monitor average order value changes after customers earn specific achievements or badges. A national clothing retailer saw 73% longer website sessions when customers engaged with shopping experiences, which translated to measurable revenue growth.
Behavioral Transformation Indicators
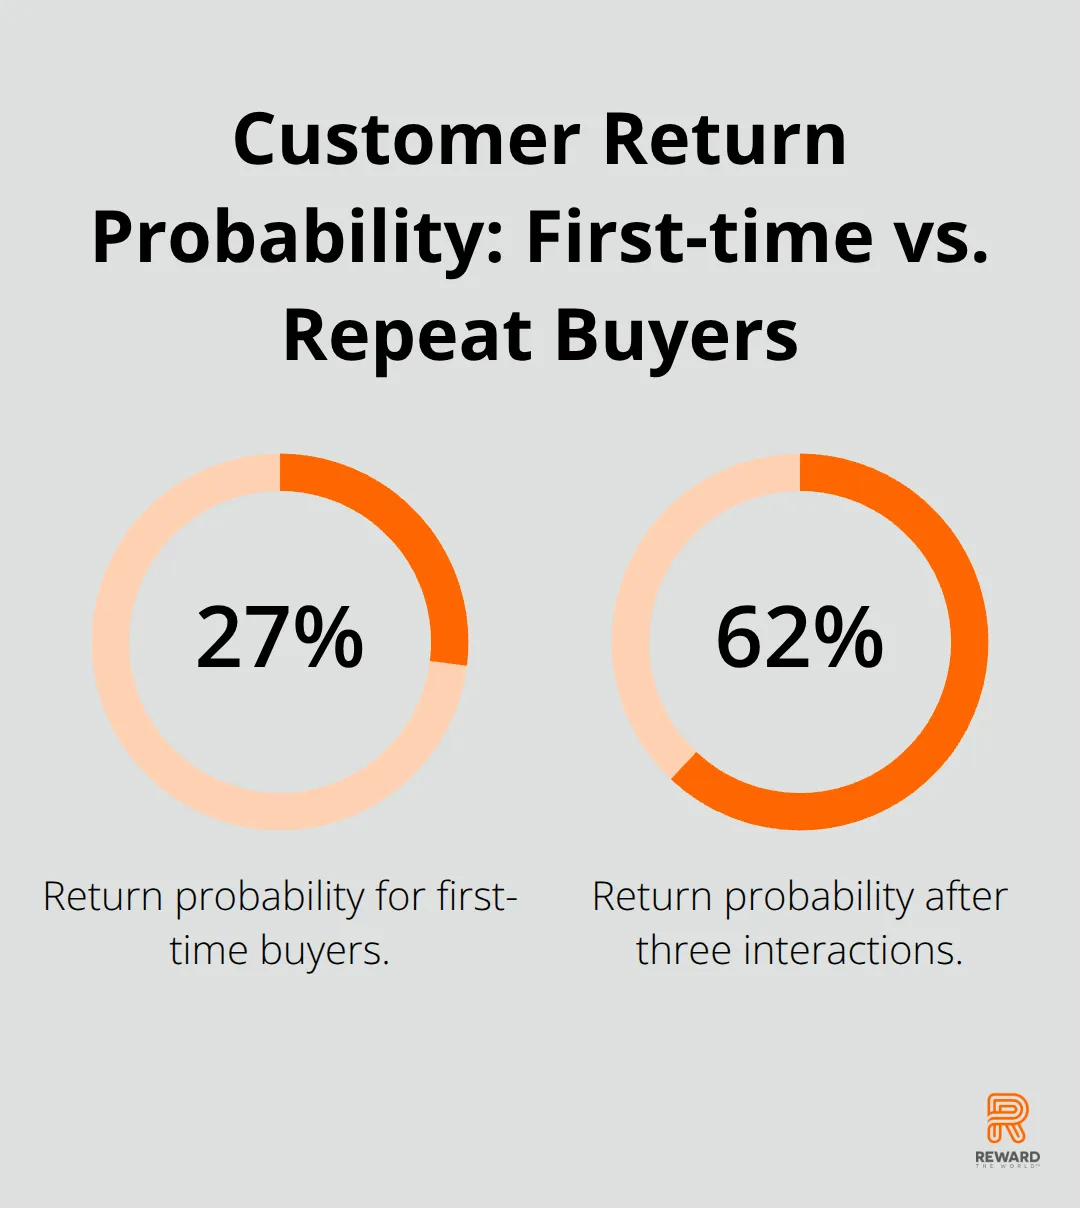
Purchase frequency shifts reveal program effectiveness better than total transaction volume. First-time buyers have 27% return probability, but this jumps to 62% after three interactions. Track habit formation through streak mechanics – successful programs show customers who maintain 21-day purchasing streaks increase retention by 45%.
Monitor cross-category purchasing behavior as challenges encourage exploration of new product lines. Companies that use sales tactics report 30-42% revenue increases within implementation months. Measure time between purchases before and after program launch to quantify behavioral acceleration.
Engagement Quality Over Quantity
Active participation metrics matter more than passive enrollment numbers. Track session duration, feature usage frequency, and task completion rates to understand true engagement depth. Programs with high-quality interactions show members who spend 5+ minutes per session convert at rates 40% higher than quick visitors.
Monitor social sharing and referral generation from program participants. These behaviors indicate emotional investment beyond transactional relationships. Advanced analytics tools help identify which specific game elements drive the most valuable customer actions, setting the foundation for deeper program assessment techniques.
How Do You Track Real Program Performance
Cohort Analysis Reveals Hidden Patterns
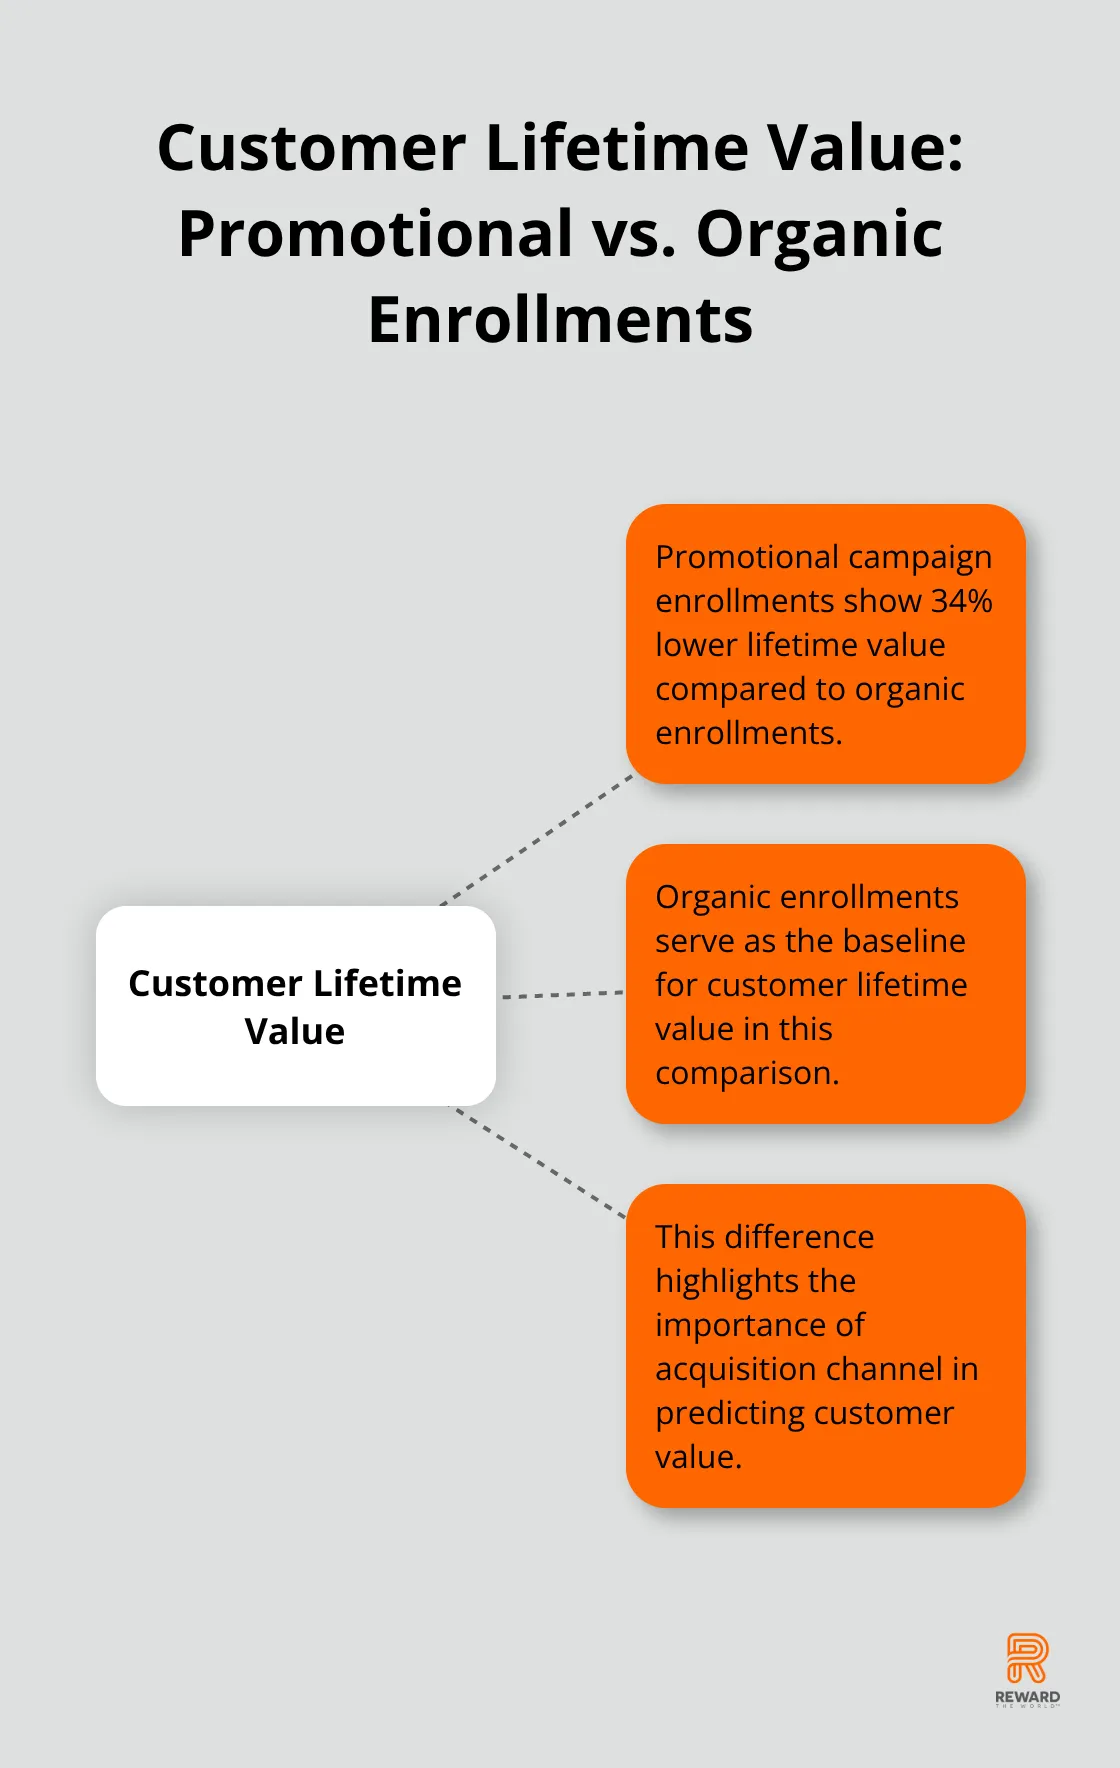
Cohort analysis exposes the true performance patterns that aggregate metrics hide. Group customers by their program enrollment month and track their behavior over identical time periods. Companies that use this method identify that customers who join during promotional campaigns show 34% lower lifetime value compared to organic enrollments.
Track monthly retention rates for each cohort – successful programs maintain 35% retention after six months while weak programs drop to 25%. Segment cohorts by acquisition channel, demographic factors, or initial engagement levels to pinpoint which customer types deliver sustainable value. This approach reveals seasonal patterns and helps predict future performance based on enrollment timing.
Attribution Models Connect Actions to Revenue
Attribution models connect specific game elements to revenue outcomes with mathematical precision. Implement last-touch attribution to identify which rewards directly precede purchases, then compare with first-touch models that reveal initial motivation drivers.
Multi-touch attribution assigns credit to multiple touchpoints along the customer journey – Sephora’s Beauty Insider Program tracks how point accumulation, tier advancement, and exclusive access each contribute to purchase decisions. Test different attribution windows from 7 to 90 days to understand your optimal influence period (most programs find 30-45 days works best).
A/B Testing Separates Winners from Losers
A/B tests reveal which mechanics actually drive results versus those that create engagement without revenue impact. Split your audience into control groups that experience different point structures, badge systems, or challenge frequencies. Test single variables at a time – companies that change multiple elements simultaneously cannot isolate successful components.
Run tests for minimum 30-day periods to capture full behavioral cycles, and maintain statistical significance with sample sizes that exceed 1,000 participants per variant. Asian Pacific retailers achieved 60% app engagement increases through systematic tests of mission board mechanics versus traditional point systems.
Advanced Analytics Tools Transform Raw Data
Modern analytics platforms transform raw interaction data into actionable insights about program performance. These tools track micro-conversions (badge earnings, level completions) and macro-conversions (purchases, renewals) to build comprehensive performance pictures. Heat maps show which game elements attract attention while conversion funnels reveal where participants drop off.
Customer data platforms integrate loyalty program metrics with broader business intelligence systems, creating unified views of customer behavior across all touchpoints. This integration becomes essential when you need sophisticated tools and methods to track program success effectively.
What Tools Actually Track Gamification Success
Customer data platforms serve as the foundation for measuring gamified loyalty programs because they consolidate behavioral data from multiple touchpoints into actionable insights. Platforms like Salesforce Customer 360 and Adobe Experience Platform track micro-interactions within games while they connect them to purchase patterns and lifetime value calculations. These systems process millions of data points daily – they track badge completions, level progressions, and reward redemptions alongside traditional commerce metrics. The most effective platforms maintain real-time dashboards that show conversion rates from specific game mechanics, which enables immediate optimization decisions.
Analytics Software That Delivers Real Results
Google Analytics 4 and Mixpanel excel at tracking engagement depth within gamified experiences through event-based measurement frameworks. These tools monitor session duration, feature usage frequency, and drop-off points to identify which game elements drive meaningful interactions versus superficial engagement. Amplitude specializes in behavioral analytics for loyalty programs – it shows how customers progress through gamification funnels and where they abandon challenges. Advanced analytics platforms calculate statistical significance for A/B tests automatically, which prevents companies from making decisions based on insufficient data samples.
Survey Tools That Capture Customer Sentiment
Net Promoter Score surveys reveal whether gamification creates genuine loyalty or temporary engagement spikes. SurveyMonkey and Typeform integrate directly with loyalty platforms to trigger feedback requests after specific achievements or reward redemptions. Post-interaction surveys capture emotional responses to different game mechanics – successful programs show improved scores for customers who complete challenges versus passive participants. Sentiment analysis tools process open-ended feedback to identify which rewards feel meaningful versus those perceived as gimmicky distractions.
System Integration Creates Complete Performance Pictures
CRM integration transforms isolated game metrics into comprehensive customer profiles that predict future behavior and spending patterns. Point-of-sale systems connected to loyalty platforms track immediate purchase responses to gamified promotions – they measure conversion rates within hours of challenge completions. The most successful implementations synchronize inventory management with reward redemption patterns (preventing stockouts of popular prizes while optimizing reward costs based on actual engagement data).
Final Thoughts
Gamification metrics demand precision beyond basic engagement statistics. The most successful companies track revenue attribution, behavioral transformation, and customer lifetime value changes rather than superficial participation rates. Cohort analysis reveals hidden performance patterns while A/B tests separate effective mechanics from expensive distractions.
Continuous optimization drives long-term program success. Programs that adapt based on data insights maintain competitive advantages over static implementations. Regular analysis prevents costly mistakes and identifies emerging opportunities for customer engagement improvements (which often appear in unexpected user behavior patterns).
Your next steps should focus on implementation of comprehensive measurement frameworks that connect game elements to business outcomes. Start with customer data platforms that integrate loyalty interactions with purchase behavior. We at Reward the World help businesses implement data-driven loyalty solutions that deliver measurable results across multiple reward categories.